Questions On Quantitative Techniques SMQTQ019

Direction: Read the given mixed chart and other information carefully and answer the questions given beside.
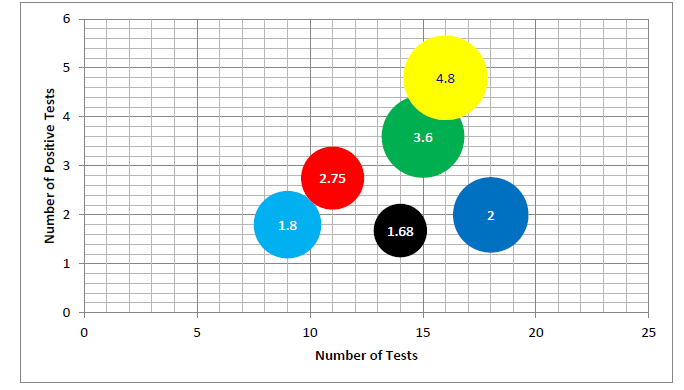
To test people for COVID-19, a city was divided into six zones. Name of zones were on the name of colours – Skyblue Zone, Yellow Zone, Green Zone, Red Zone, Blue Zone, Black Zone as shown below in bubble chart.
The bubble chart below shows numbers of tests that were conducted for COVID-19 and the number of positive outcomes in various zones.
The number of positive outcomes is shown on each bubble for the corresponding zone.
The numbers of tests are to be found by the x-axis value of the vertical line that passes through the centre of a given bubble.

All data is in thousand.
1. Find the average number of people that were tested in Green Zone, Skyblue Zone, Red Zone and Black Zone.
A. 11550
B. 12250
C. 13125
D. 12500
2. The number of people who were found positive in Yellow Zone was what percent more than the number of people who were found positive in Skyblue Zone?
A. 164 %
B. 166(1/3) %
C. 166 %
D. 136 %
3. Find total number of people who were found positive in all the Zones combined.
A. 1663 thousand
B. 16.3 thousand
C. 13.63 thousand
D. 16.63 thousand
4. A number of new people, which is twice the already tested number of people, are tested in Blue Zone, and the numbers of positive outcomes are more than 50% of previous outcomes. Find approximately what percent people are found positive (old + new positive) in Blue Zone out of total tests.
A. 7.8%
B. 8.1%
C. 9.2%
D. 10%
Correct Answers:
1. B
2. C
3. D
4. C


